How To Make A Flow Chart in Microsoft Word 2007

A flow chart is a very effective way to present ideas in a visual fashion. Here’s how to make a flow chart in Word 2007.
A flow chart is a very effective way to present ideas in a visual fashion. Prior to tools like Microsoft Office 2007 you had to have some basic skills with graphic design and a lot of free time to make professional looking flow charts. Using the tools in Word 2007 though, you can create them quickly with hardly any skill or effort at all.
What a Flow Chart Is
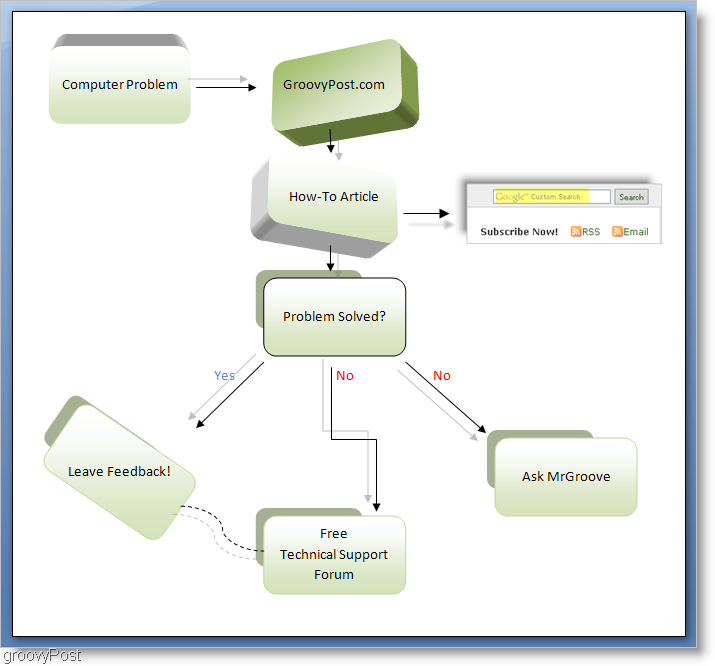
What is a flow chart? Here is an example. This was made using Microsoft Word 2007. This How-To article will explain how to make a flow chart in this way.
Let’s get into building a flowchart for yourself. Before we start, however, let’s get familiar with the tools and let’s get our copy of Word prepared for the task.
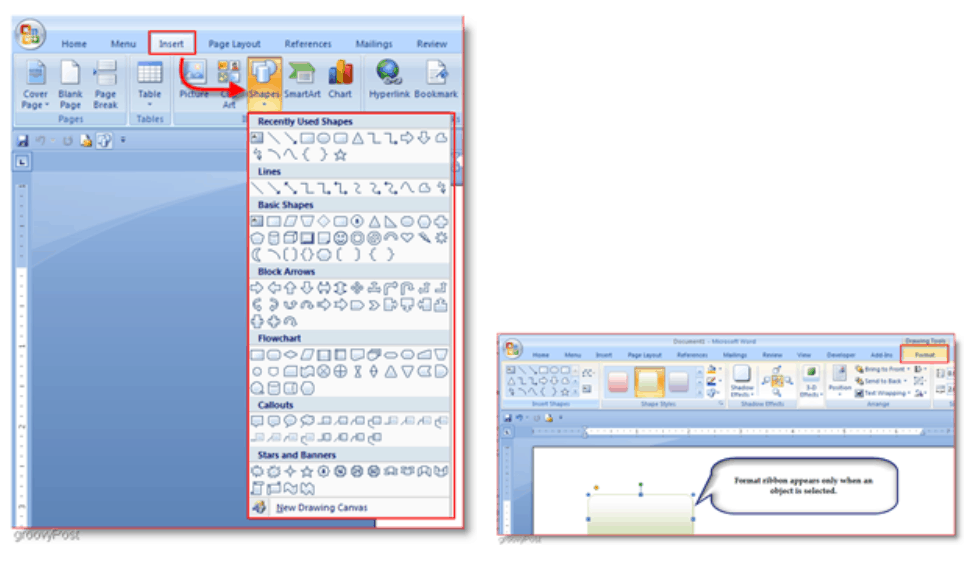
There are a couple of tools that we will use to make a flow chart. The first tool is the Shapes tool located under Insert > Shapes. The second is the Format tool, located at the end of the Ribbon but only when an object is selected.
For convenience, while making flow charts, I like to add the shapes tool to the Quick Access Toolbar.
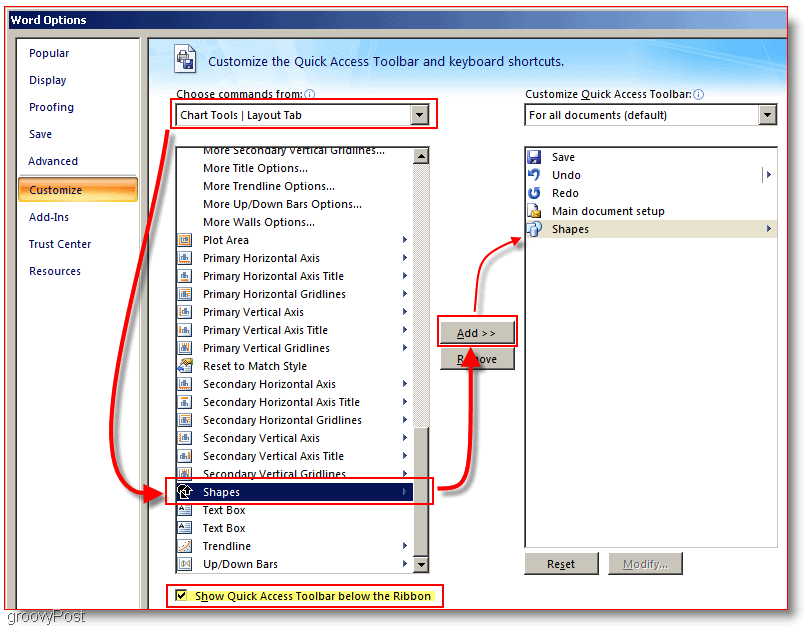
To do this Click the Office button then Click Word Options. Now in the Word Options window Click Customize then Click then Choose commands from list and Select Chart Tools | Layout Tab. Then scroll down the on the list below and Click Shapes then Click the Add button. Now for additional convenience, Check the box that says Show Quick Access Toolbar below the Ribbon. Now Click OK.
Now it should be added to to the toolbar and the toolbar should now be located underneath the main ribbon menu.

Okay now that we have to tools set up, lets make an actual flow chart!
How to Make a Flow Chart with Word 2007
1. Click the Shapes tool and select a shape you would like to use.

2. Most people making flow charts will want their charts to maintain size consistency. The easiest way to do this is using Copy and Paste. Right-Click the Shape you just created and Select Copy, and then Right-Click on an empty space and Select Paste to create a duplicate. Do this as many times as you need, to create as many duplicate shapes as you require.

3. Add some text to your boxes, Right-Click a shape and Select Add Text. Then just enter it in and format accordingly.

4. Now to add some lines to make your chart flow, there’s a variety to choose from. Click the Shape tool and pick a line you want to use. Now Click and Drag to Draw a line with the mouse.

5. At this point you could call it done, but honestly it looks pretty plain. Let’s Spice it up a bit using the Format tool. Click the Format tool from the ribbon and let’s start out with a style. To manually select additional shapes Hold Ctrl and Click each additional Box. This works on both boxes and arrows.


6. Next you can add even more effects or stick with the way it is. The Shadow or 3-D effects can really make your chart stand out.

7. This is optional, but you can Insert Smart Art. Smart Art is just a pre-designed set of graphics to make things easier. Click the Insert ribbon, and then Click the SmartArt button. Select a graphic that suits you and then Click OK to insert it. If you are having trouble moving a Smart Art graphic on your document then Use the Format > Position tool.

Complete

So go out there and make some groovy Flow Charts using Microsoft Word 2007! If you have any questions regarding this or any other topic please head on over to the groovyPost Free Technical Support and Community Forum.


SpockMan
May 15, 2009 at 7:05 pm
RAD! Thanks I HAVE BEEN SEEING THESE EVERYWHERE. Wanted to know how to make one and here it is!
nocode
May 20, 2010 at 10:04 am
Well your tutorial didn’t create the document at the top. Looking for a way to add text to the connectors like in the first image, and this post didn’t cover that.
MetroDinosaur
May 20, 2010 at 11:11 am
As far as I know Word doesn’t have text connectors so I’m guessing he just typed the words on there using an inserted text box or he could have even just typed them on the document page itself.
Paula
September 10, 2010 at 6:58 am
I need to place boxes side by side on a flow chart. They will not be connected to each other, but boxes below so that 2 parallell flows are created.
How can I do this in Word 2007?
Thanks,
Paula
Jock
April 1, 2011 at 10:10 pm
What you (and all other sites re word flowcharts) forget to mention is before YOUR step 1 there is the real step 1 which is:
1. Click the Shapes tool and select ‘New Drawing Canvas’ at the bottom of the list (word 2007).
You then create your flowchart inside this canvas.
Why?
Because when, for example, you connect 2 objects with, say an arrow, without a canvas, the arrows don’t ‘click’ into place. With the canvas they do. Then, if you move the object, the line moves with it.
Another good reason for using the canvas is if you want to copy your flow chart to another program, Excel for example, once in Excel try moving your chart all at once without a canvas. You can’t. You have to select each object once by one. With a canvas you just move the canvas.
HD-Electric Inc.
May 26, 2011 at 3:48 pm
Thank You Jock for the info on the Canvas – I am fairly well trained with MS Word – and did not know this bit of Information. That was why I was looking for a tutorial on creating flow charts, as it seemed quite cumbersome to create them in Word and Excel. After creating the canvas – I was able to create a lovely flow chart in about a half hour. Thanks for this very important piece of the puzzle.
Hoda
August 19, 2011 at 2:45 am
hi, thanx for u all comments,and thanks for the topic.it helped me!
srtBoulder
October 20, 2011 at 7:13 am
Key word is Canvas. Thanks. I struggled for long time to make the connectors function. They always acted weird. Then I found this ‘New Canvas’ thing, thank you! In Canvas they function very well.
Thanks again.
jason
November 2, 2011 at 10:46 pm
thanks mate very helpful. I had office for all these years and didnt know it could do this woot! much appreciated :)
Thomas
April 9, 2015 at 3:10 am
Thank you, found this very helpful.