How to Use Windows Counters in Perfmon to Troubleshoot PC Issues

If your computer is acting up, Windows has built-in tools like Performance Monitor to help you troubleshoot issues. Here is a detailed look at using the tool on your Windows PC.
Most PC owners often do very little to maintain their computer systems. Many people install Antivirus software and that’s the extent of it. But performance monitors offer a very valuable way for you to get some insight into why your computer might be misbehaving.
The term performance monitor (also commonly known as “perfmon”) sounds like an advanced IT tool, but it’s very accessible even for a regular computer user.
In this article, you’ll learn more about the “performance counters” that give you insights into every aspect of your computer. You’ll also learn how to graph the relevant counters so you can identify where any problems might be.
What’s a Performance Counter?
You can think of a performance counter like a sensor inside your computer that constantly measures the health of different systems and processes. A basic example of this is your computer’s processor. As you can imagine, in a healthy system the processor should be very active when loading or running applications, but inactive when you’re not doing anything.
Here’s what a standard performance monitor graph of % Processor Time looks like:
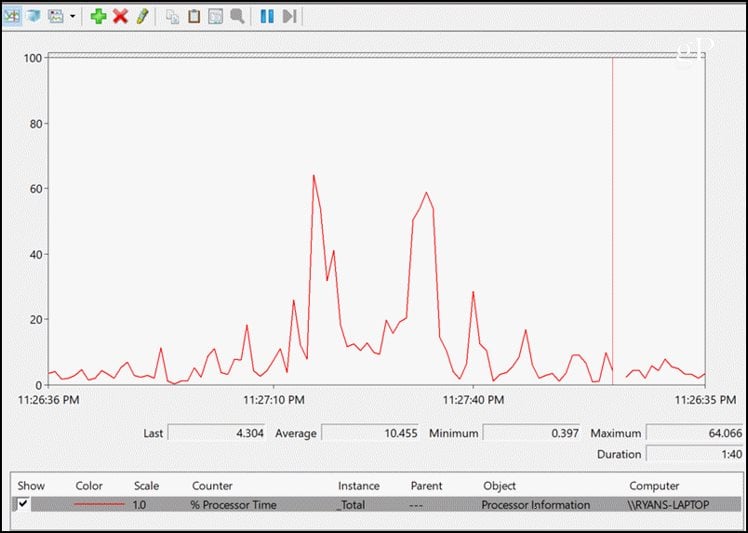
Even just this single counter can give you lots of insight into any symptoms your computer might be experiencing. For example, if the processor time never drops under 40 or 50 percent, that could be a sign that there’s some background application or service that’s bogging down your computer.
Let’s take a look at how you can create your own troubleshooting performance monitor graph, starting with monitoring the health of your computer’s hard drive.
Physical Disk (Hard Drive)
There are two groups of performance counters when it comes to your hard drives; physical disk or logical disk.
- Physical Disk reports on information about the physical hard drive or drives.
- Logical Disk reports on the individual partitions, like the C: or D: drives.
While there’s plenty of interesting information you can learn from logical disk counters, for the purposes of troubleshooting we’re going to focus on the physical disk.
Here are the critical counters you can use to monitor the health of your physical hard drives.
- % Idle Time: How much time the physical disk has been idle. This means all tasks that the OS system sent the disk are completed and the disk has nothing more to do. A hard disk shouldn’t be less than 60% idle for a long period of time.
- Disk Reads/Sec and Writes/Sec: These two counters tell you how many read or write requests from the OS the disk is processing per second. A high volume of reads or writes over a long period of time could signal malware or a virus excessively accessing the hard drive.
- Disk Sec/Write: This counter tells you how long in seconds it takes to write data to the hard disk. This process is usually less than 25 ms. Any longer could signal a failing hard disk.
- Avg. Disk Queue Length: This number tells you how long the hard drive queue of I/O operations are. This typically shouldn’t be more than 2 or 3 operations. Any more than that means your hard drive could be the bottleneck that’s slowing down your computer.
- Split IO/Sec: This is the rate that requests to write data encounter fragmentation of the drive and need to split the file into segments. This rate is usually very low after you’ve defragmented your hard drive. A high counter here means your disk could be severely fragmented.
To add counters to the performance monitor, just press the green plus icon at the top of the chart, find the “Physical Disk” section in the list of available counters, and then press the Add button to add the counters you want.

Click OK and you’re in business! Now you’ll see all of the counters you chose charting in real-time.
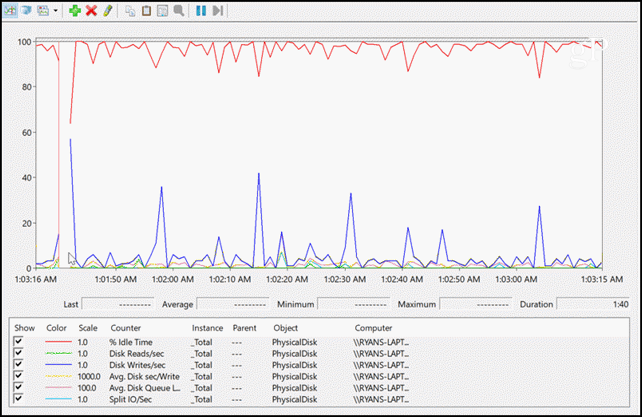
While the chart view looks pretty cool, you might be wondering how you can see if any of the values are above or under the limits that represent a problem? All you have to do is click Change Graph Type menu icon, and choose the Report option.
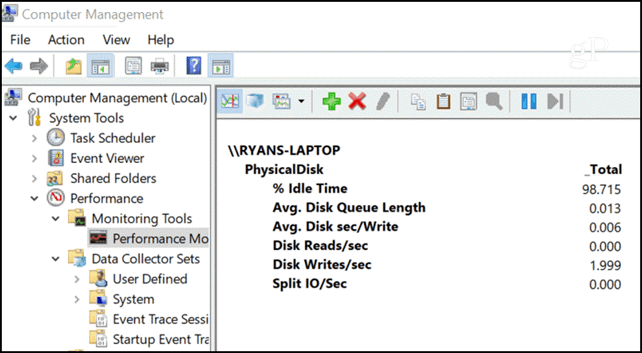
Any excessively high or low values will show up here consistently over time when you have any serious hard disk problems. We don’t cover Logical Disk counters here because these counters are reported for a logical unit (section) of the hard disk, and not as important as Physical Disk counters when troubleshooting hardware issues.
However, if you are concerned about monitoring whether your logical disk (like C: or D:) is low on space, you may want to take a look at the % Free Space or Free Megabytes counters under the Logical Disk section.
Memory (RAM)
Memory is the “short term” storage area, otherwise known as random access memory (RAM), where the processor stores information that it needs to access quickly while processing different requests.
If your computer memory is healthy and working well, this information transfers very fast. The memory area also never fills up completely, because when you close applications, the OS is smart enough to “release” that area of memory for some other use. How do you know when problems are happening with your RAM? There are performance counters for that.
- Pages/Sec: This is how many pages of information are transferred to or from the disk to resolve hard page faults. A page fault sounds scary but it’s simply an event where the information the computer needs isn’t in the short term memory area, so it needs to be retrieved from disk. This is normal, but shouldn’t happen too frequently.
- Available Mbytes: This tells you how much RAM is available for use. There was a time when opening too many windows on a computer could consume all of the RAM and crash the computer. These days that’s rarely the case, but malware, viruses, or badly programmed applications can still cause this to happen.
- Cache Bytes: This is how much memory is being used for your file system cache. If you notice that the cache is getting very small, it could indicate that you’re running out of memory which will lead to poor performance. If it grows too large, it could mean your hard drive is not keeping up, forcing the system to cache more information as it waits.
- % Committed Bytes in Use: This is the ratio of used memory to the memory limit. This is an easier counter to monitor than Available Mbytes because it compares usage to the known memory limit for you. If you see this counter remaining over 80% for an extended time, you have a memory leak, or you need to upgrade your RAM.
Adding all of these to a performance monitor provides you with a good picture of the health of your computer’s memory.

You’ll notice between 10:51:00 and 10:51:35, the % Committed Bytes dropped. This was from closing several Chrome tabs and other open applications. Each spike in Pages/sec were a direct result of actively using different applications.
It’s fascinating to see how these performance counters show you what’s going on with your system, and how clearly they can reveal to you that something is going wrong.
Network Issues
Another problem that can make people think their computer is slowing down is network issues. Many times people assume that just because web pages are loading slowly, it means their “computer is slow.” The reality may be that the computer is running fine, but either the local network or the Internet connection itself is the bottleneck. How can you know? Let’s go back to the performance counters.
- Bytes Total/Sec: This is how many bytes every second are transferred to and from your network adapter. The limit here is easy to figure out if you know the max speed of your NIC. For example, a 1000-Mbps NIC card has a maximum transfer rate of 125MB/sec. The total bytes/sec you’re monitoring should never go over 70% of that or 87.5MB/sec. If it does, your NIC card can’t keep up with the traffic demands.
- Output Queue Length: This counter tells you the number of packets in the output queue. If the queue is more than 2 packets, your NIC card is struggling. This is just another “sensor” to tell you that your NIC card can’t handle the network demands you’re placing on it.
Keep in mind when you’re adding these counters to the performance monitor, you’ll need to select the correct network card you want to monitor.

A healthy network card should look something like this (if you’re actively using the Internet).

The last, and probably the most important, area of the computer that you’ll want to monitor with performance counters is the processor and individual processes.
Many computers these days actually come with multiple processors, so you’ll see those listed when you add the performance counters. You can monitor all of them at once, or individually. If you’ve reviewed performance monitors for all of the other areas of your computer and you can’t see anything that might be slowing things down, the processor or core system could very well be the culprit.
Here are the most important processor-related performance counters you should add when you’re building you perfmon chart.
- % Processor Time: This is the most important counter because it tells you what percentage of time the processor isn’t idle. If this is over 75% for long periods of time, the processor is being overwhelmed by the demands placed on it.
- % User Time: This counter can help you understand if it’s a user application that’s consuming processor time.
- % Interrupt Time: This counter will show you if hardware interrupts are taxing the processor. This is an easy way to identify a potential hardware failure. This should never be higher than 20%.

Here are the most important process-related performance counters to monitor. This can tell you if there’s an application causing performance issues.
- Handle Count: An application issues a “handle” whenever a new window opens. If it doesn’t manage handles properly, the number of handles currently open can continue to grow. This is known as a “handle leak”.
- Thread Count: This counter tells you the number of threads open by an application. If an application doesn’t properly close threads when finished tasks, this can lead to a “thread leak” and a continued rise in threads.
- Private Bytes: This counter will show you how much RAM a process is using. If you notice this continues to rise without stopping over time, the application may have a memory leak.
Process counters are especially interesting when you select specific applications from the list in the performance monitor. This is useful because if you suspect an application is causing performance issues, you can chart these performance counters and see evidence that it’s the culprit. Below is an example of the performance monitors above charted for all open sessions of Google Chrome.

Any of these lines headed only in an upward direction would identify an application (process) problem. Many times, a quick glance at these charts tells you all you need to know to fix the problem.
Perfmon Isn’t Black Magic
So, the next time your computer starts acting like a school bus in a mud bog, launch the performance monitor and start poking around some of the counters described above. You’ll be surprised just how quickly you identify something that will lead you to an answer. Sometimes all it takes is a replacement part or uninstalling an application, and it’s like you have a brand new computer again.