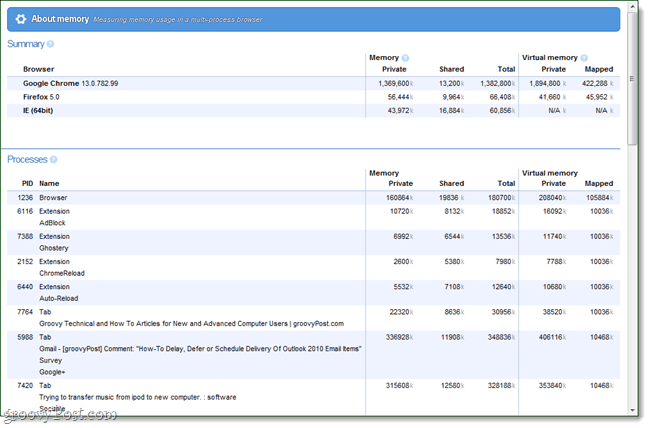

So here’s what we are looking at. Chrome can can track the memory used by itself, but also other browsers currently open and running on your computer. Firefox, IE, Opera, and others are all visible in Chrome’s about:memory page.


Private Memory Vs. Shared
The Chrome memory tab bunches up memory into a few different categories. The first two are private and shared, and this is a division of normal (physical) memory in your system. Private memory is memory that is used specifically by one application or process. Shared memory on the other hand is used by at least two applications, if not more. When looking at it from the Chrome perspective, Shared memory use isn’t entirely relevant –but if the private memory used is lower than the shared memory, it generally means that particular process or browser is working efficiently.
Virtual Memory vs. Memory (Physical)
Physical Memory is also known in most computers as Random Access Memory (RAM). RAM is a dedicated physical component inside of the computer that is designed specifically to load programs into it. Virtual Memory acts as a buffer or recycle bin when the maximum amount of RAM has been exceeded or with a portion of RAM that has not been recently used but is still needed. With Windows for example, if you minimize a program and then open another it will automatically switch the minimize program over to Virtual Memory. Virtual Memory rather than being written to a dedicated memory component, is instead saved to your computers storage disk. The drawback of Virtual Memory is that it is much slower than physical RAM.
Other Google Chrome Debug Tools
If you type about:about in the Chrome browser it will bring up the complete debug list. They are as follows:
- about:about
- about:appcache-internals
- about:blob-internals
- about:view-http-cache
- about:credits
- about:conflicts
- about:dns
- about:flags
- about:flash
- about:gpu-internals
- about:histograms
- about:memory
- about:net-internals
- about:plugins
- about:stats
- about:sync-internals
- about:tcmalloc
- about:terms
- about:version
2 Comments
Leave a Reply
Leave a Reply


groovinJackman
August 12, 2011 at 1:01 pm
Don’t bother checking out blob internals. It’s just more blob.
Ziggy
August 13, 2011 at 3:47 am
Blob to some, a gold-field for geeks. Thanks. Now I can tinker with things I shouldn’t – but I promise I will be careful! (Snigger…)